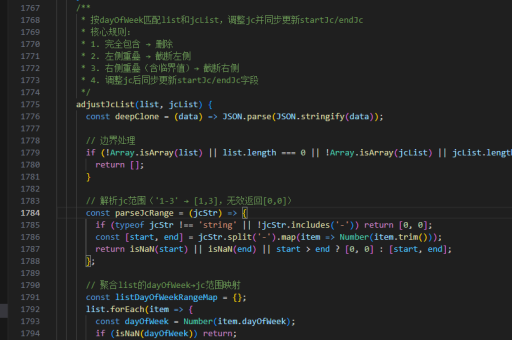
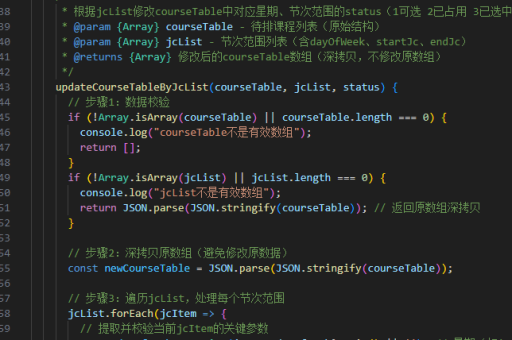
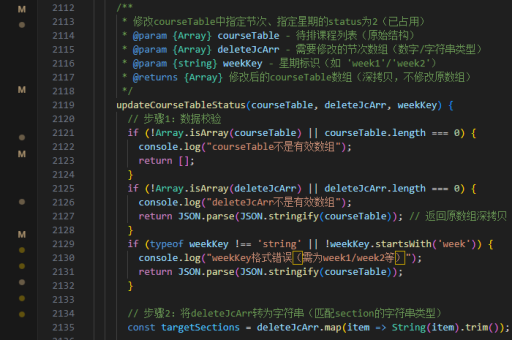
vue实现柱状折叠图
Vue 实现柱状折叠图
使用 Vue 结合 ECharts 可以轻松实现柱状折叠图。以下是具体实现步骤:
安装依赖
确保项目中已安装 ECharts 和 Vue-ECharts:
npm install echarts vue-echarts基础实现
在 Vue 组件中引入 ECharts 并配置折叠柱状图:
<template>
  <div ref="chart" style="width: 600px; height: 400px;"></div>
</template>

<script>
import * as echarts from 'echarts';

export default {
  mounted() {
    this.initChart();
  },
  methods: {
    initChart() {
      const chartDom = this.$refs.chart;
      const myChart = echarts.init(chartDom);

      const option = {
        tooltip: {
          trigger: 'axis',
          axisPointer: { type: 'shadow' }
        },
        legend: {
          data: ['数据1', '数据2']
        },
        grid: {
          left: '3%',
          right: '4%',
          bottom: '3%',
          containLabel: true
        },
        xAxis: {
          type: 'value'
        },
        yAxis: {
          type: 'category',
          data: ['类别1', '类别2', '类别3']
        },
        series: [
          {
            name: '数据1',
            type: 'bar',
            stack: 'total',
            label: {
              show: true
            },
            emphasis: {
              focus: 'series'
            },
            data: [320, 302, 301]
          },
          {
            name: '数据2',
            type: 'bar',
            stack: 'total',
            label: {
              show: true
            },
            emphasis: {
              focus: 'series'
            },
            data: [120, 132, 101]
          }
        ]
      };

      myChart.setOption(option);
    }
  }
};
</script>
进阶功能
实现折叠展开交互效果:
// 在option中添加dataZoom配置
dataZoom: [
  {
    type: 'slider',
    show: true,
    yAxisIndex: 0,
    start: 0,
    end: 50
  }
]
响应式处理
添加窗口大小变化时的自适应:
mounted() {
  this.initChart();
  window.addEventListener('resize', this.handleResize);
},
methods: {
  handleResize() {
    if (this.myChart) {
      this.myChart.resize();
    }
  }
},
beforeDestroy() {
  window.removeEventListener('resize', this.handleResize);
}
注意事项
- 确保在组件销毁时销毁图表实例:
beforeDestroy() { if (this.myChart) { this.myChart.dispose(); } } - 对于复杂交互需求,可以使用 ECharts 的事件系统:
myChart.on('click', function(params) { console.log(params); }); - 要优化性能,可以启用懒加载或虚拟滚动技术处理大数据量场景。
通过以上方法,可以在 Vue 中实现功能完善的柱状折叠图,包括基础展示、交互功能和响应式处理。根据实际需求,可以进一步调整图表样式和交互细节。